User Guide
Base layers are the main satellite views. Water vapor layers show moisture flow, IR layers show cloud-top temperature day/night, and false-color layers make clouds, smoke, and land/water boundaries easier to distinguish.
Overlays add context (like boundaries or analysis). Keep overlays minimal so you can still read the cloud structure underneath.
Radar-style quicklooks and static analysis graphics are also available in the Bulletins/Quick-look area; use them alongside the satellite loops for storm tracking.
Quick image gallery
A fast side-scroll view of the latest products across full-disk, mesoscale, and derived datasets.
A false color RGB image assigns the satellite's different wavelength measurements to the red, green, and blue channels, revealing contrast between clouds, smoke, dust, snow, and water.
Mesoscale focus windows
NOAA only publishes two active mesoscale sectors at a time (Mesoscale 1 and Mesoscale 2). They can be repositioned anywhere in the U.S. domain, so where they point can change over time.
Mesoscale Rapid Refresh

Mesoscale Rapid Refresh


Thermodynamic Fields
No exact frame for this product at the selected time; showing nearest available timestamp instead.
Product Insight
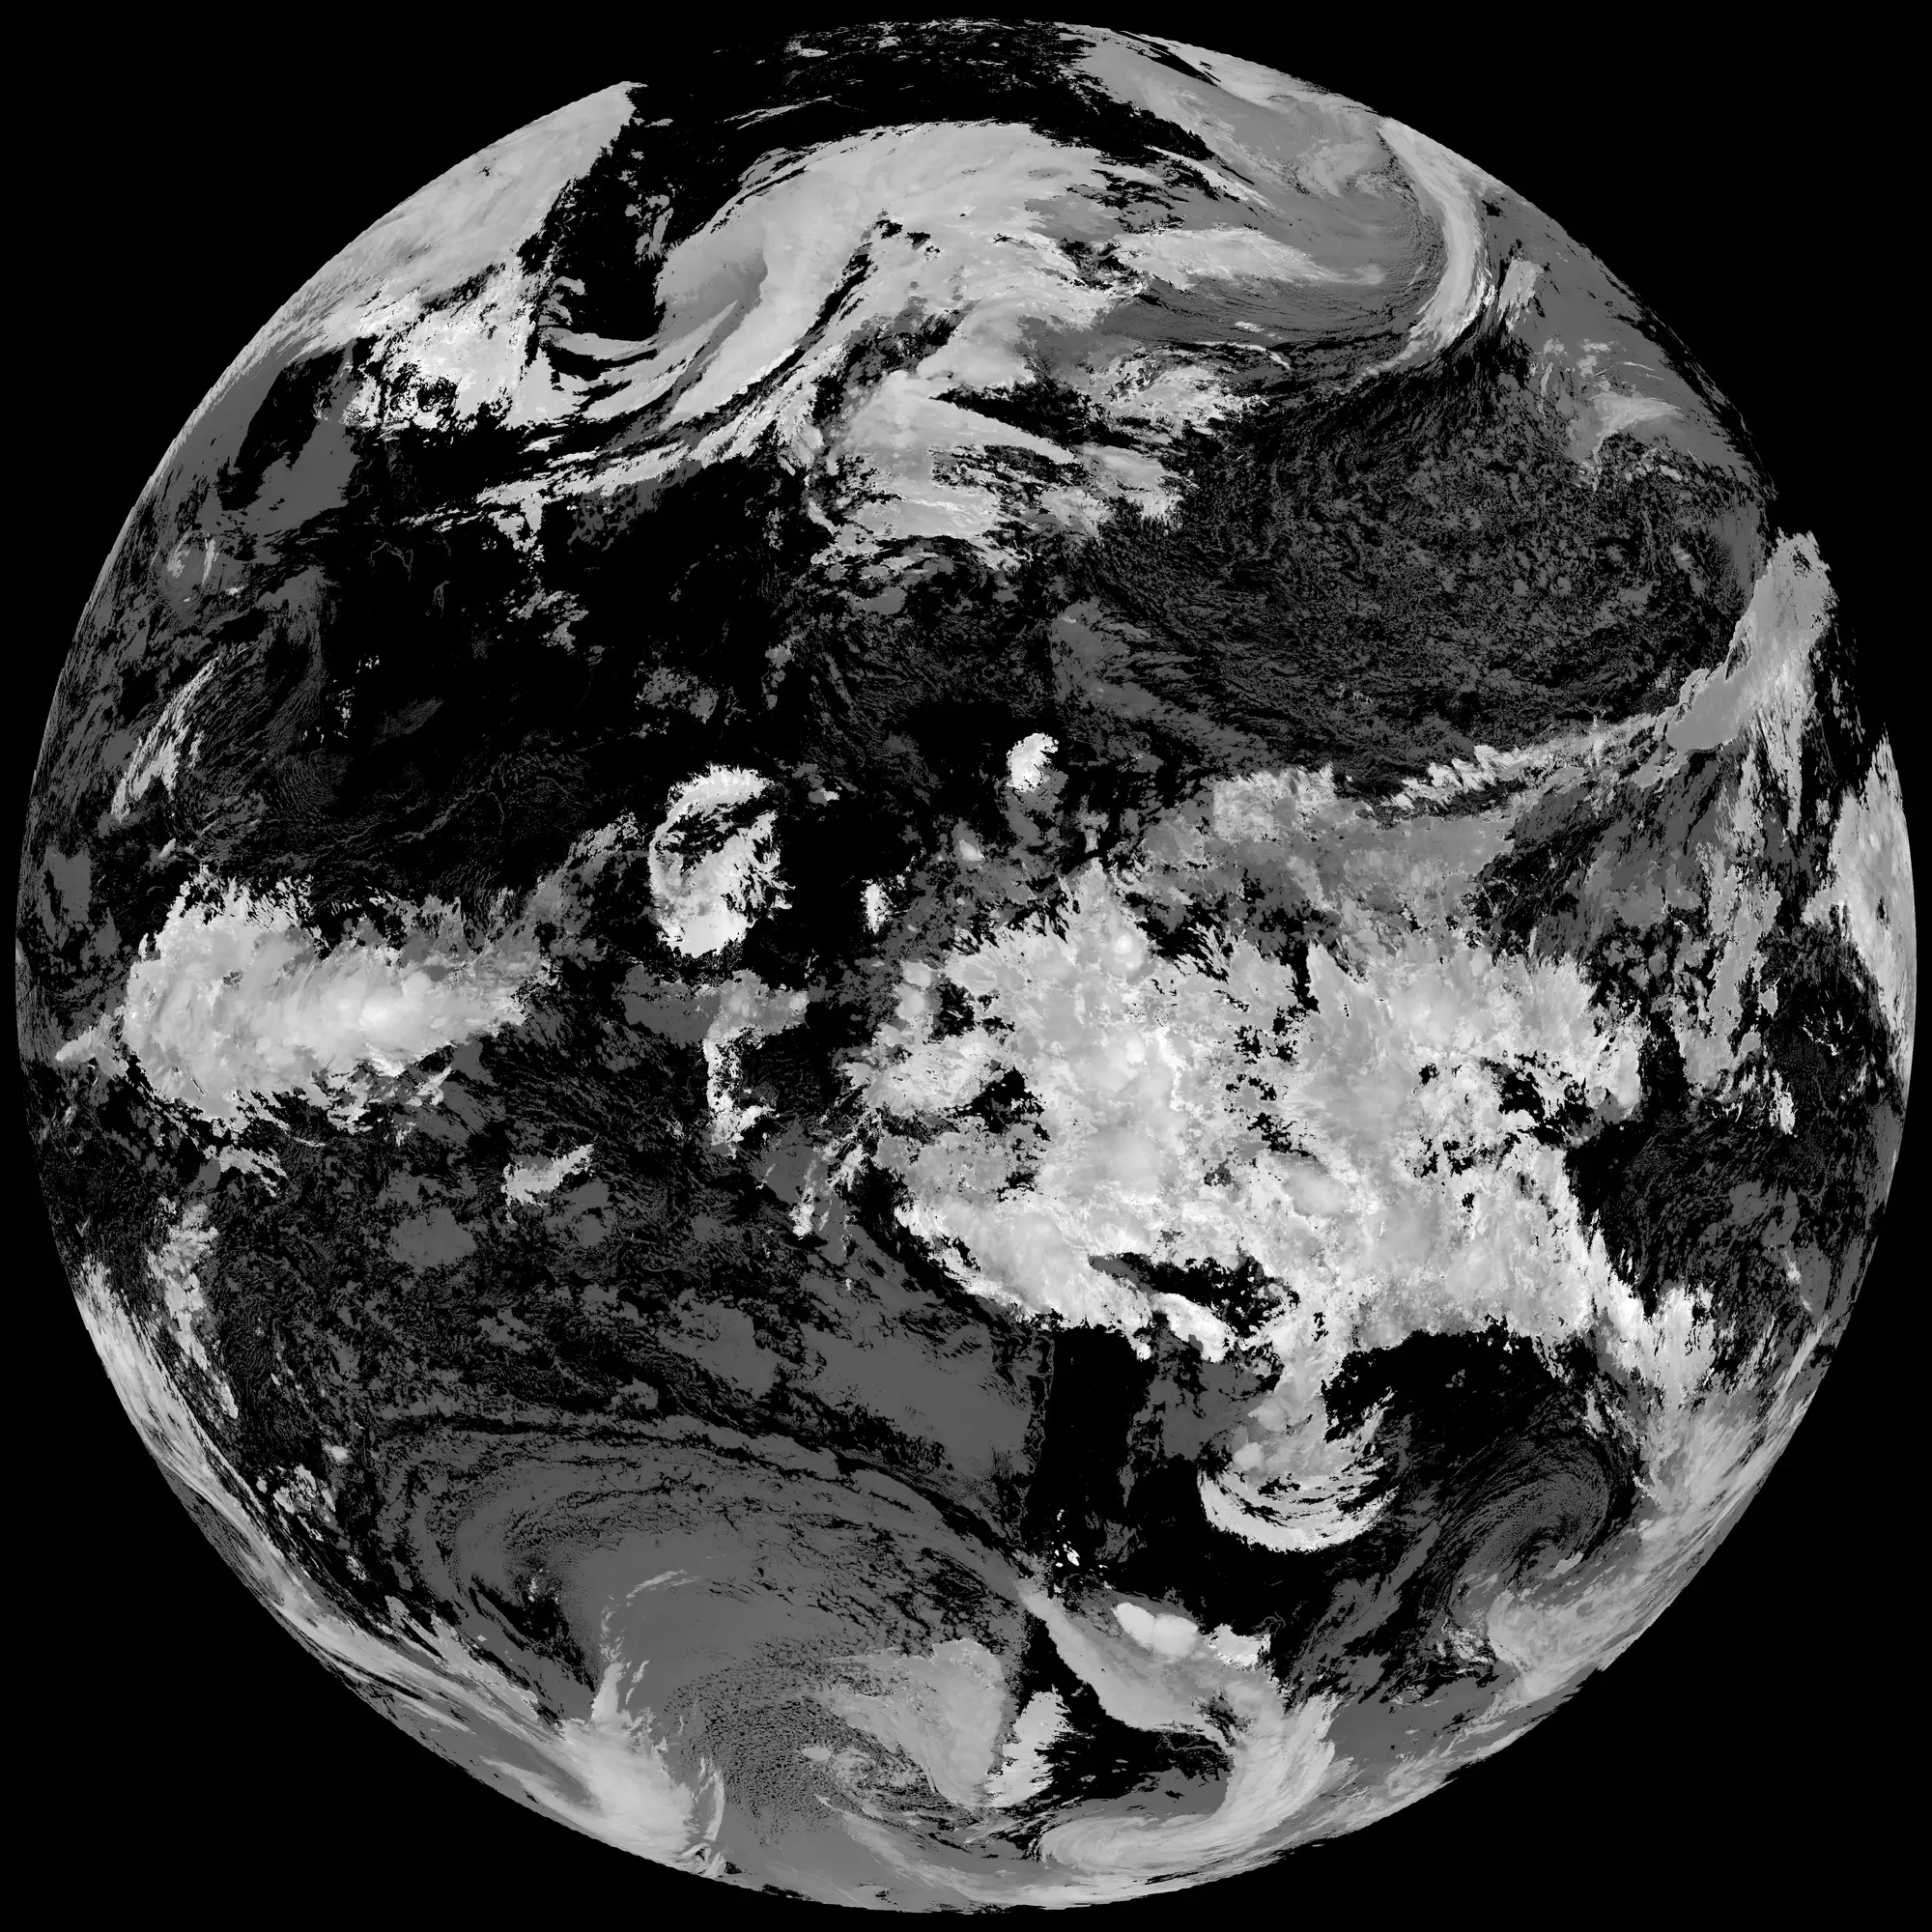
Estimates the temperature of cloud tops, helping gauge storm intensity and aviation hazards such as icing or turbulence.